Measuring above full scale
The reference P.56 implementation assumes input samples in the range
\([-1.0, 1.0]\) and reports all levels in dB relative to that full scale
(dBov). p56-asl keeps that contract, but adds an extended mode
(auto_calibrate=True) that adapts the measurement reference when the
signal's peak exceeds full scale, so unnormalized material is measured
correctly instead of saturating the analysis.
The amplitude reference and the histogram grid
The meter measures the smoothed envelope \(q[n]\) against a geometric grid of thresholds:
math
c_k = \frac{\text{max\_amplitude}}{2^k}, \qquad k = 1 \dots 23
The top threshold sits at max_amplitude / 2; each bin below it covers
half the amplitude of the one above (−6.02 dB per bin). max_amplitude
defaults to 1.0 (full scale), and all reported levels are dB re. full
scale (1.0), independent of the grid position.
What happens when the peak exceeds full scale
If the envelope rises above the top threshold max_amplitude / 2, the top
histogram bins saturate: every sample is counted in every bin, the activity
counts lose their structure at the loud end, and the margin analysis
(P.56's speech/silence test) no longer resolves where the envelope sits.
The reference implementation is simply not defined for this case — its
documented input range is \([-1, 1]\).
Extended mode (auto_calibrate=True)
With auto-calibration enabled, the meter watches the block peak: whenever a
block contains a sample whose magnitude exceeds the current
max_amplitude, the reference is doubled (repeatedly, if needed) until it
covers the peak, and the histogram follows:
- thresholds ×2 — the grid shifts up by exactly +6.02 dB (\(20\log_{10} 2\));
- activity counters slide down by the same number of bins, so every counter stays attached to the absolute level it was measuring;
- the new top bins, which cover levels no earlier sample could reach, start fresh.
The calibration exists so the grid covers the signal — it never changes what is measured, only the resolution at the loud end.
Measurement invariance
Because the counters stay attached to their absolute levels, the
reported active level, activity factor and RMS are identical to what
the meter would have reported with the reference configured to the
final value from the start — pinned by a bit-identical comparison of
auto-calibrated vs. fixed-reference runs in the test suite.
The extended mode is a library option; the CLI does not expose it:
from p56_asl import ActiveSpeechLevelMeter

meter = ActiveSpeechLevelMeter(sample_rate=48000.0, auto_calibrate=True)
Illustration
The figure below shows a synthetic burst signal whose peak steps from
0.35 (well below full scale) to 1.5 and then to 3.5:
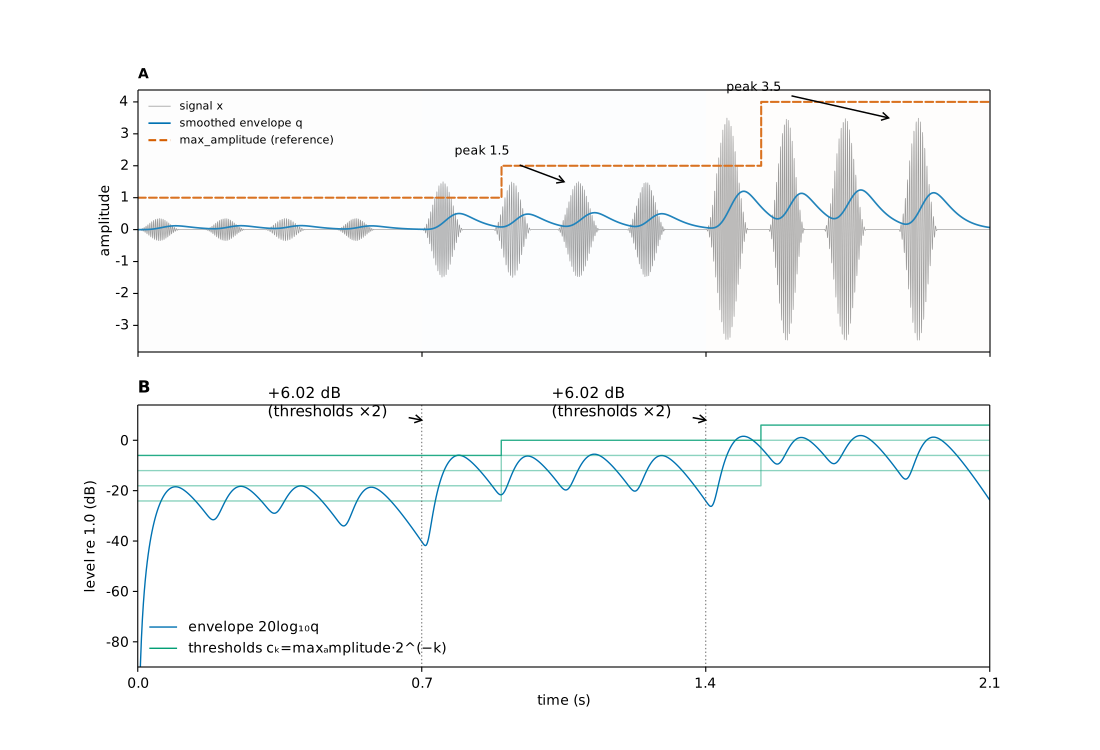
A — the signal with its smoothed envelope \(q\), and the adapting
reference max_amplitude (dashed red). The first phase stays below
full scale, so the reference remains 1.0. When the first 1.5 peak
arrives, the block triggers a doubling: max_amplitude 1.0 → 2.0. The
3.5 peak later triggers another: 2.0 → 4.0.
B — the envelope and the histogram threshold grid \(c_k = \text{max\_amplitude}\cdot 2^{-k}\) (green), all in dB re. full scale. Each doubling lifts every threshold by exactly +6.02 dB — the grid shifts as a rigid staircase at the two calibration instants, and the envelope, which would otherwise sit far above the top threshold, is again covered by the grid.
The thresholds shown (\(k = 1 \dots 4\)) are the top four bins of the 23-bin grid; the remaining bins follow the same staircase below the plotted range.
Reproducing the figure
The figure is generated by scripts/gen_extended_mode_figure.py:
uv run python scripts/gen_extended_mode_figure.py